Datadog-grade visibility without Datadog-grade bills.
OBSERVE is self-hosted, AI-first observability for Kubernetes. One Helm install gives you metrics, logs, traces, eBPF auto-instrumentation, security events, network flows, SLOs, incidents, and an eleven-agent AI swarm for root-cause analysis, inside your own cluster.
Every hop is instrumented. When one of them goes wrong, the swarm says which.
eBPF traces every request between services, with no code changes. Metrics, logs and traces land in one place, from the same chart. An error rate crosses its burn-rate threshold and an incident opens. Specialised agents read the evidence and name the likely cause.
What one install gives you.
Everything below is provisioned by the Helm chart, in the namespace you choose, with no runtime database for alerting.
Metrics
VictoriaMetrics with vmagent, kube-state-metrics and node-exporter.
Logs and traces
ClickHouse with the OpenTelemetry Collector receiving and routing telemetry.
eBPF auto-instrumentation
Beyla L7 spans for HTTP, gRPC, SQL, Redis and DNS, with zero code changes.
Network and security
Retina for eBPF network flows and policies; Tetragon for syscall-level runtime security events.
SLOs and incidents
Burn-rate tracking against VictoriaMetrics; ClickHouse-backed incident management and log fingerprinting.
AI swarm RCA
Eleven specialised agents (metrics analyst, log deep-diver, pathfinder, sentinel, finops, oracle, architect and more).
MCP server
Exposes the same tools to external agents such as Claude, Cursor and Copilot.
Alerting and access
Alertmanager and vmalert, ConfigMap-driven. Project scoping, multi-cluster discovery and RBAC.
The interface.
Two pages from the app. Both were captured with the demo data mode on, which the badge in the top bar shows.
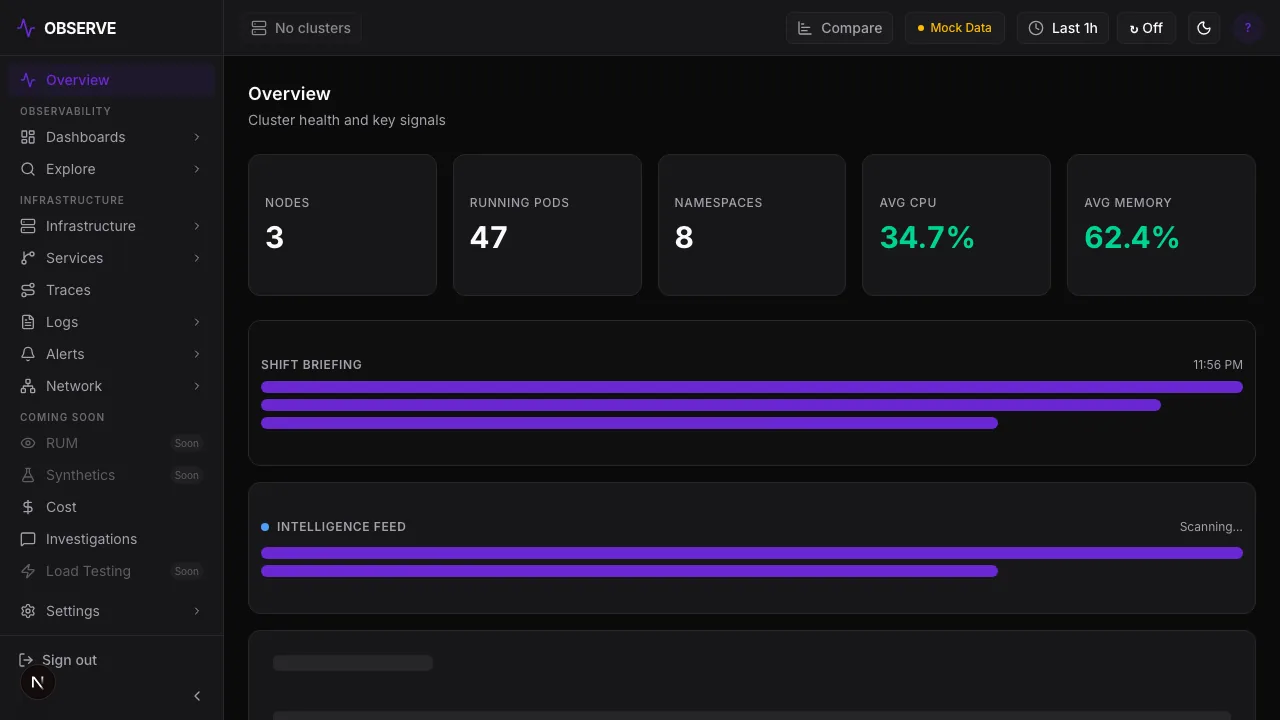
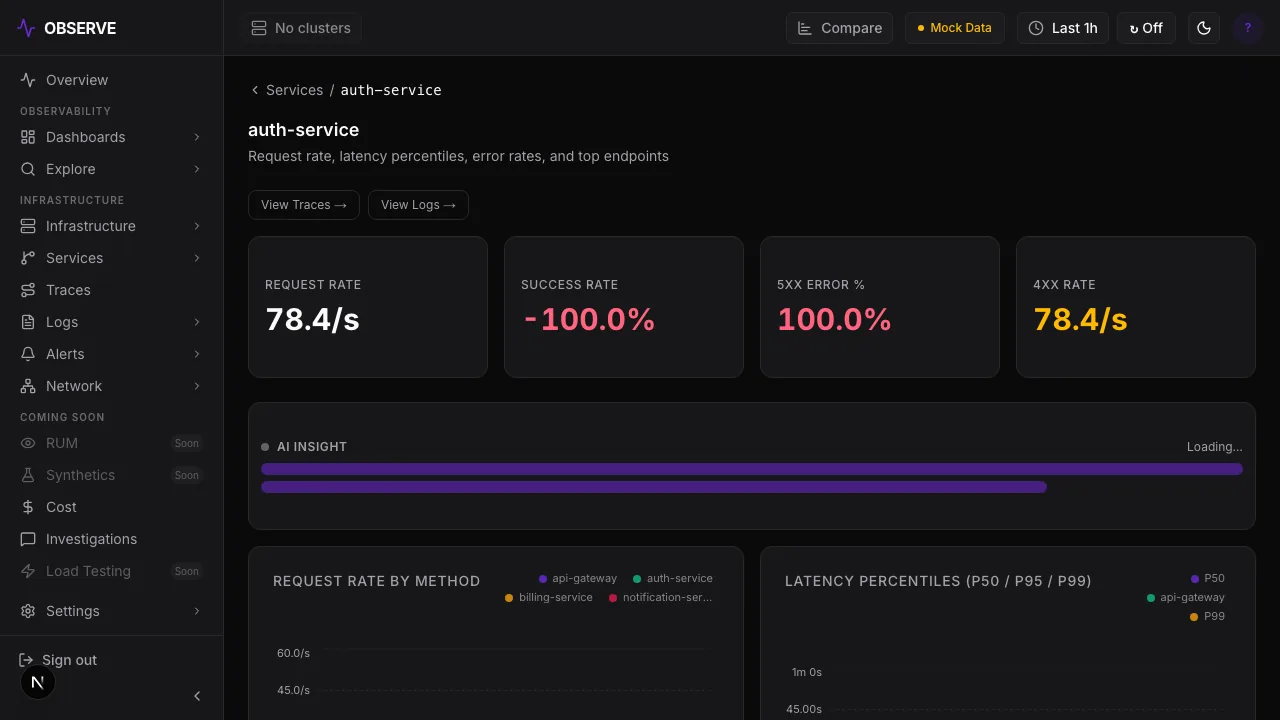
$ helm upgrade --install observe-runtime \
    oci://ghcr.io/shashank2577/charts/observe-runtime \
    --namespace observability --create-namespace \
    --wait --timeout 15m

# then: kubectl get svc -n observability observe-app
One chart. NodePort, a hostname, or your existing ingress.
The chart carries the data plane and the app. Pin the chart and image versions you want; the live demo runs the same chart on a small k3s cluster.
See real eBPF data flowing.
The demo cluster is public. OBSERVE is a working beta from Sovix; ask us about running it in your own cluster.